I love making computers do things no one's seen before.
I work between design and engineering, in whatever stack the client already has, from brand-new startups to big companies with their own process: GitHub, NBC News, CBS News, the Washington Post, the New York Times.
I take the tight-deadline projects that need short sprints and real user testing, especially things no one has built before.
You can grab 20 minutes on my calendar or email me at [email protected].
How I work
If you hand me a dataset, I'll perform some lightweight meta-analysis: how much, what type, top entities, any graphs/hierarchies, any timelines or maps to be made. Then I'll bring them to the group to figure out how and where to dive in further, and turn it into a piece of narrative journalism with dataviz-first thinking.
By the end of the first day you'll have a map of what is in the pile, a sort of survey of the land in terms of data and resources, and probably a few custom built tools to let a non technical person do deep analysis and joy-based exploration on their own, without needing me to "be their hands".
Selected work
Global Energy Ownership Tracker
You can trace the full ownership chain behind a single project, down to the stakes held by the likes of BlackRock and EDF. The ownership chain is where a lot of the truth is.
We took a 200GB leak and turned it into something a reporter can explore in the browser.
29,915 officer nodes, 159,671 relationships. When Gothamist reporter George Joseph took the names to the street and interviewed victims, the graph held up.
You can send me an email at [email protected] (PGP) or grab some time on my calendar.
Experience
Lenfest AI Fellow
I built a tool that uses AI to lay out the ads and stories in small local print newspapers
I gave an Ignite talk about it at ASU’s National Journalism + AI Accelerator in January 2026
Design Engineer & Creative Technologist
I take the tight-deadline projects that need short sprints and real user testing, especially things no one has built before
I helped CBS News prototype its broadcast touchscreen app, analyzed newspaper front pages for the New York Times, and made geographic visualizations with the geniuses at Stamen.
I work between design and engineering, in whatever stack the client already has, from brand-new startups to big companies with their own process
I work in public when I can. There are 50+ Observable notebooks, plus livestreams on YouTube and blog posts about what I'm making and how.
Founder
My prototyping shop for new kinds of data visualization and analysis, usually on tight deadlines
I built the studio’s manager on top of an LLM. It’s our ‘AI team member’
We turn rough ideas into demos good enough for a client to show their bosses or take to a funder
I worked with the Associated Press team on its 2024 election coverage, which was nominated for a Webby.
I helped the Wildlife Conservation Society map coral reefs that are holding up against climate change and tell their story
Contractor
I made geographic visualizations with the Stamen team
Senior Interactive Graphics Specialist
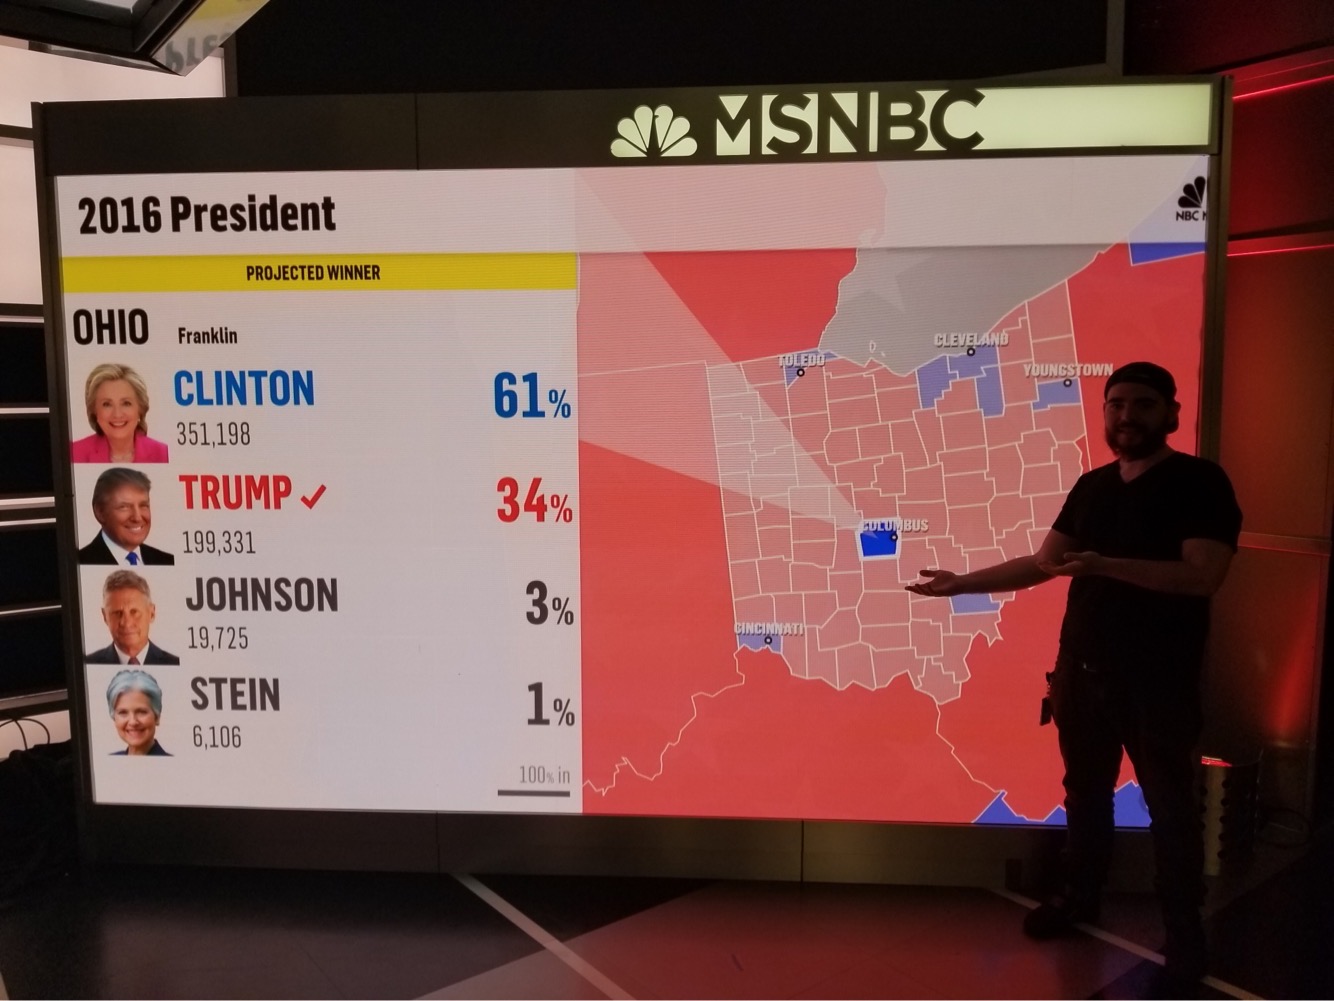
I was lead designer on the 2018 relaunch of the election-night Big Board and built it with Michael Small and the NBC News Digital teams. The New York Times called it “newly juiced-up.” It’s still in use today.
Graphics Editor
I automated enough of the desk to go from five graphics a month to five a day
I led the winning Knight Foundation grant pitch for Dataproofer, a tool that checks datasets for errors
I gave reporters a visualization platform they could use on their own, made the templates, and ran daily breaking-news graphics
Freelance
I worked with the GitHub team on the “State of the Octoverse” site and its visualizations
Staff Designer
I was on the core team that built one of the first visualization-as-a-service platforms
Projects
Skills
Clients









Kind words
“Gets things done quickly with an astonishing level of detail”
“Build things that would last… not just produce, but take ownership of long-term initiatives”
“Instant solutions to tough problems, under intense time pressure”
“First election night where Chuck wasn’t frustrated with the app.”
“Subway Builder takes a minimalist visual approach that it knocks out of the park. Its real-life map contains every street and building you could see in person…”
Book a call